


The Step-By-Step System To Find Cash-Flowing Properties In Any Market (Even Today’s Market)
Why Most Investors Can’t Find Deals—And How You Actually Do It
Here’s what I hear constantly: “Dustin, properties are too expensive. I can’t find deals. The market is crazy.”
My response is always the same: You’re looking in the wrong place.
Most investors limit themselves to their backyard. They live in San Francisco or Nashville or any expensive market, so they think they have to invest there. Then they complain properties don’t cash flow.
But here’s the truth: You don’t have to invest where you live.
There are hundreds of markets across America with better cash flow, lower entry points, and more inventory than wherever you are right now.
The question isn’t “Why can’t I find deals?” The question is “Why haven’t I looked everywhere?”
I’m going to show you the exact system I use to find cash-flowing properties in any market, analyze them properly, and decide whether to buy them as long-term rentals or short-term Airbnb properties.
This isn’t theoretical. I walked through this live with my students, analyzing actual properties on actual platforms, in real time.
Here’s how it works.
Inventory Is Everywhere (You Just Can’t See It Yet)
When you’re looking for real estate deals, you’re actually looking for inventory.
Think about it like running any other business. If you owned a clothing store, you’d scout locations with high foot traffic. If you owned a restaurant, you’d look for neighborhoods with density and demand.
Real estate is the same. You’re looking for markets with high inventory—lots of properties for sale that could potentially cash flow.
Most investors never see this inventory because they’re only looking at their zip code, their city, maybe their state.
They miss the goldmine happening two states over.
Plus, there’s a special offer for MPI audience: Go to incomebuilder.io
Income Builder Promo code: PODCAST Discount: 20% off for life
Here’s what I did in a recent live workshop with my students: I pulled up a map of the entire United States on Zillow and looked at every single market.
Do you know what I saw? Red dots everywhere. Hundreds of markets with available properties.
Some markets had just a handful of red dots (limited inventory). Some markets had clusters of red dots (good inventory). Some markets had swarms of red dots (excellent inventory).
The clustering tells you everything. When you see 50+ red dots concentrated in a city, you know: there are properties to buy, there’s market activity, and there are enough deals that you could build a serious business there.
When you see 5 red dots scattered across a rural county, you know: limited inventory, limited property managers, limited opportunity.
The first step to finding deals isn’t analyzing properties. It’s finding markets with inventory.
Step 1: Filter For Your Deal Parameters (On Zillow)
I start on Zillow with specific filters. Here’s my system:
Price Range I look for properties under $250,000. This is my sweet spot because:
- Lower purchase price = easier to cash flow
- Easier to find buyers or renters
- Less capital required
- Better for scaling quickly
You can adjust this based on your target market, but I’d never go above $400,000 if you’re starting out.
Property Type I filter for houses only. No condos, no townhomes, no multi-unit complexes (yet).
Why? Condos and townhomes have HOA fees that kill cash flow. Townhomes are harder to manage. Houses are what families want to rent, and families are the most stable tenants.
Bedrooms & Bathrooms I target 3-bedroom, 2-bathroom properties.
This is the sweet spot for rental demand. Families want this configuration. It’s not too small (1-bed apartments don’t attract stable tenants). It’s not too big (4+ bed homes are harder to rent and attract party situations).
Square Footage I want between 1,200-1,750 square feet.
Properties under 1,200 sq ft attract renters who are transient and less stable. Properties over 1,750 sq ft become harder to rent and don’t cash flow as well relative to their price.
The 1,200-1,750 range is the Goldilocks zone—families want it, renters will stay longer, and cash flow works.
Apply These Filters Once you set these filters, zoom out to the entire United States and look for clustering of red dots.
Don’t analyze specific properties yet. Just look for markets.
Where do you see the most red dots? Those are your target markets.
Step 2: Identify Markets With Inventory (Strategic Drilling)
Here’s what I see when I zoom out on the US map:
Texas – Massive concentration of properties. Houston, Dallas, Austin, San Antonio all have incredible inventory.
Ohio – Underrated market. Cincinnati, Cleveland, Columbus have solid inventory and great cash flow.
Florida – Large state with consistent inventory across multiple cities.
Alabama & Georgia – Emerging markets with excellent inventory and cash flow. Birmingham and Atlanta are booming right now.
Pennsylvania – Overlooked market with decent inventory.
When you see clustering like this, you know: there’s a real market. There are property managers. There are investors already buying. There’s demand.
When you zoom into a rural county and see 10 properties total, you know: pass. Not enough inventory to build a business.
Pro tip: I’ve learned that my students love investing in Birmingham, Alabama right now. Why? Not because I told them to, but because they followed this system, saw the red dots, and realized it’s a legitimate market.
Once you identify 3-5 target markets, you drill in deeper.
Step 3: Check Rental Rates (The Critical Step Most Investors Skip)
Before you analyze a single property, you need to know: Can this property even cash flow?
The quickest way is to check rental rates.
Switch your Zillow filter from “For Sale” to “For Rent” and look at the same area.
For a property listed at $115,000 for sale, scroll through the “For Rent” listings in that neighborhood. What are 3-bedroom houses renting for?
I’ll see prices like: $1,200, $1,300, $1,500, $1,700.
This tells me the market can support $1,200+ rents.
Now I can make a rough calculation in my head:
- Purchase price: $115,000
- Down payment (20%): $23,000
- Loan amount: $92,000
- At 6% interest over 30 years: ~$550/month mortgage
- Property tax estimate: ~$100/month
- Insurance estimate: ~$75/month
- Maintenance reserve (10%): ~$120/month
- Property management (10%): ~$120/month
- Total expenses: ~$965/month
- Potential rent: $1,250/month
- Rough cash flow: $285/month
If that math works, I drill deeper. If it doesn’t, I pass.
This takes 90 seconds per market. It’s the fastest way to eliminate bad markets before wasting time analyzing individual properties.
Step 4: Analyze Specific Properties (Using Income Builder)
Once you’ve identified a market and confirmed rental rates work, you analyze individual properties.
This is where Income Builder’s analyzer changes everything.
Here’s the exact process from my workshop:
Find The Property Search for a specific address in Zillow. Pull up the listing.
Example: 1709 3rd Street, Birmingham, Alabama
- Listed at: $115,000
- 3 bed, 2 bath, 1,100 sq ft
- Estimated rent: $1,270/month
Input Into Income Builder Analyzer
- Address (auto-populates)
- Offer price (I offer below asking; $95,000 instead of $115,000)
- Down payment (20%)
- Interest rate (6%)
- Market value after repairs ($115,000)
- Property tax per year (auto-estimated, but verify)
- Insurance per year (auto-estimated, but verify)
- Monthly rent ($1,250 conservative estimate)
- Vacancy rate (5% standard)
- Property management fee (10%)
Get Your Analysis Income Builder runs the math instantly.
You see:
- Cash flow: $479/month ✅ (Green light—above $400 minimum)
- Cap rate: 5.2% ✅ (Green light—above 5%)
- 1% rule: Passes ✅ (Green light—rent is 1%+ of purchase price)
- Equity capture: ✅ (Green light—you’re buying below market)
All green lights = good property.
The beauty: This took 2 minutes.
Most investors would spend 2 hours hunting through excel sheets trying to do this math manually.
Here’s where most investors don’t realize the true power of Income Builder:
Once you analyze a property and see it’s a good deal, you can click “Share” and generate a public link.
You send that link to potential investors.
They see:
- Purchase price
- Down payment required
- Mortgage details
- Estimated rental income
- Operating expenses
- Projected cash flow
- Cap rate
- ROI
Everything. The entire financial breakdown.
They see a property that will generate $479/month in cash flow for them as an investor (if they’re passive equity partners).
They invest.
This is how you fund deals without going to banks or begging friends for money. You show them the actual underwriting. You show them the numbers.
It’s that simple.
Step 6: Long-Term vs. Short-Term—Testing Both Models
Here’s where it gets interesting.
The property we analyzed looked good as long-term ($479/month cash flow).
But what if you could make more as short-term (Airbnb)?
Income Builder has built-in calculators for both.
Testing Short-Term Potential
Same property (1709 3rd Street, Birmingham).
Instead of estimating $1,250/month rent, I go to Airbnb and search the area.
I find similar 3-bedroom, 2-bath properties renting for $160/night.
Now I do the math:
- $160/night × 22 nights/month (conservative—accounting for vacancy)
- = $3,520/month revenue
This is drastically higher than long-term rent ($1,250).
I plug $3,520 into the Income Builder analyzer.
But I also increase expenses because short-term requires more:
- Cleaning between guests: $300/month
- Extra utilities (more usage): +$100
- Maintenance (wear and tear): +$200
- Property management fee: 15% (higher than long-term’s 10%)
Income Builder recalculates. Cash flow might be $940/month instead of $479/month.
Same property. Different strategy. Doubled cash flow.
But here’s the catch: Short-term only works if the market supports it. Phoenix has 40,000 Airbnbs—it’s saturated. Little Rock has fewer, so short-term works better there.
Income Builder lets you test both scenarios instantly.
Step 7: Move To Portfolio (The Operating System)
Once you decide to buy, you “move to portfolio” in Income Builder.
Now the property rolls from “analyzer” to “your actual business.”
All documents transfer. All analysis history saves. You now have:
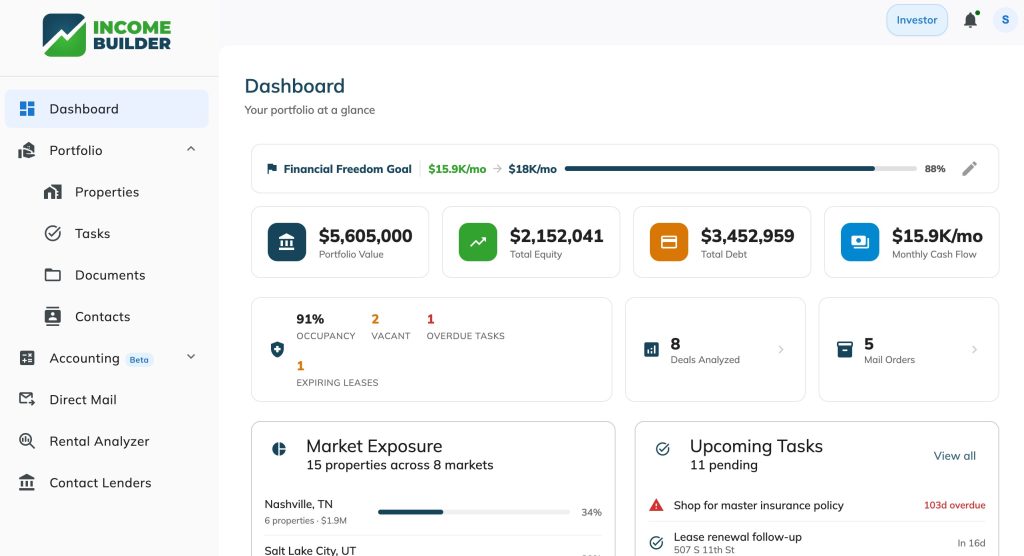
Portfolio Dashboard
- Total equity position
- Total cash flow
- Market diversification (how much in each city)
- Properties per status (rented, vacant, under contract)
Property-Level Details
- Tenant information
- Lease documents
- Loan information
- Task reminders (insurance renewal, license renewal, etc.)
- Documents stored by property
- Contacts linked to each property
- Accounting transactions
The Real Game-Changer: Visibility
When Juan (the developer) first set this up for himself, he made a discovery:
He opened Income Builder and saw: “You’re at 65% of your financial freedom goal.”
This single data point changed his entire investing timeline.
He realized he was closer to financial independence than he thought. He accelerated. He added more properties. Now he’s at 85% and projects hitting his $5,000/month goal in 2-3 years.
He didn’t have this visibility before Income Builder. He was guessing. Operating in the dark.
Now he sees everything. Clear numbers. Clear progress. Clear path to freedom.
Step 8: Accounting—The Part That Saves You Thousands
Most investors skip this. Big mistake.
Income Builder has an integrated accounting module.
Every transaction flows in. Every expense gets categorized. Every property generates real reports.
At tax time, instead of your accountant spending 10 hours hunting through your files for $2,000+ in fees, they spend 1 hour reviewing clean reports.
Savings: $1,000-2,000/year per property.
Juan discovered something else: He was paying $10,000+/year in insurance.
Because he could see this in the accounting dashboard, he investigated. He found a master policy discount and cut that to $7,000/year.
Savings: $3,000/year. From one data point.
This is what happens when you track your business. You find the leaks. You plug them.
The Real-World Results From My Workshop
In one live session, I walked through this system with my students.
Within 45 minutes:
Greg analyzed a property: $68,000 purchase, $58/month cash flow potential (good starter deal)
Jack analyzed a property: $55,000 purchase, $541/month cash flow (excellent deal)
Frank analyzed a property: $95,000 purchase, $500/month cash flow (solid deal)
Todd analyzed a property: $90,000 purchase, $466/month cash flow (very good)
Maggie analyzed a property: $95,000 purchase, $437/month cash flow (good)
All of these were real deals. All of them would cash flow. All of them were analyzed in minutes instead of hours.
This is what becomes possible when you have a system.
The Bottom Line: It’s About Systems, Not Luck
Most investors think finding deals is hard because they’re doing it wrong.
They’re analyzing 1-2 properties per week. Getting analysis paralysis. Never pulling the trigger.
With this system (Zillow for market identification + Income Builder for analysis), you can:
- Identify 5 target markets: 15 minutes
- Analyze 10 properties per market: 30 minutes
- Get clear yes/no decisions: instant
- Generate investor reports: 1 click per property
You can go from “I can’t find deals” to “I’ve analyzed 50 deals this week” in less time than it takes to watch Netflix.
The system scales. The work doesn’t.
Start here:
- Pull up Zillow. Zoom out to the entire US. Look for red dots.
- Identify 3-5 markets with good inventory clustering.
- Check rental rates on those same markets (switch to “For Rent” filter).
- Go to incomebuilder.io. Set up your account (30 days free).
- Analyze properties in your target markets.
- Move the good ones to portfolio. Track your progress toward financial freedom.
Within 30 days, you’ll have analyzed more properties than most investors analyze in a year.
You’ll find deals. Real deals. Cash-flowing deals.
Then you’ll understand why I’m not worried about “the market being too expensive.”
There are always deals. You just have to know where to look.
—Dustin

Get the FREE Real Estate Investing Guide

Free Investor Training

Related Articles
Get What You Need To Successfully Invest in Real Estate
Get All of the MPI Courses Plus Coaching!
6 Masterclass Courses
Premium online courses for any level of investor: beginner-advanced. Completely go at your own pace and can be taken through “Self-Study” or through “Membership”.

Group Coaching
Fast-track your investing success with access all past students’ work. Get access to the list of places to invest, business contacts, lenders, and resources other students have already found.

Investor Community
Work with MPI Coaches and Students inside the MPI Student Community.
Student Success Program
Pair up with another like-minded student for accountability, and crush your investing goals together.

Real Estate Wealth Builders
Get the coaching, education, community, and resources you need to become a successful real estate investor.